AJNR Am J Neuroradiol 17:1283-1289, August 1996
Reprint permission granted by Jason Gantenberg
Editorial Assistant, Permissions Editor
American Journal of Neuroradiology
|
Gerald M. Roth, Belinda Sun, Fred S. Greensite, Ira T. Lott, and Rosalind B. Dietrich AJNR Am J Neuroradiol 17:1283-1289, August 1996 |
© American Society of Neuroradiology Reprint permission granted by Jason Gantenberg Editorial Assistant, Permissions Editor American Journal of Neuroradiology |
PURPOSE: To determine whether persons with Down syndrome have features of premature aging on routine MR imaging sequences. METHODS: Sixty MR studies (in 30 persons with Down syndrome and 30 age- and sex-matched control subjects) were reviewed retrospectively by two blinded examiners. Sagittal T1-weighted and axial T2-weighted spin-echo images were evaluated for the presence and severity of three markers of brain aging: atrophy, white matter lesions, and T2 hypointensity of the basal ganglia, referenced to the examiner's internal standard of normal for that age and sex. RESULTS: Persons with Down syndrome had higher prevalence and severity of the three markers studied than the control subjects. Atrophy and white matter lesions increased in prevalence with age; abnormal T2 hypointensity of the basal ganglia was more equally distributed with age. CONCLUSION: Persons with Down syndrome have features of premature aging detectable at routine MR imaging.Received August 17, 1995; accepted after revision January 19, 1996.
Index terms: Age and aging; Brain, magnetic resonance; Down syndrome
Noninvasive cross-sectional imaging techniques have proved useful in studying the effects of normal aging on the human brain. Initially, computed tomography (CT) demonstrated that atrophy of the brain occurred as a part of normal aging (1). On magnetic resonance (MR) imaging, these findings of atrophy were confirmed, and new age-related changes in the brain were discovered. T2-weighted MR images showed the development of deep white matter lesions (2) and decreased signal intensity of the basal ganglia (3, 4) in elderly patients. These three findings—atrophy, white matter lesions, and T2 hypointensity of the basal ganglia—are now considered components of normal aging (5, 6).
Evidence indicates that persons with Down syndrome age prematurely. Not only do they show degenerative changes in physical appearance, such as in skin and hair, earlier than mentally retarded persons without Down syndrome (7), they also show the neuropathologic features of Alzheimer disease earlier than the general population. By the age of 45 years, virtually all persons with Down syndrome have senile plaques, neurofibrillary tangles, and granulovacuolar degeneration of nerve cells (8). Persons with Down syndrome also have a shorter life expectancy than the general population (7, 9).
In this study we sought to determine whether MR imaging could show evidence of premature aging of the brain in persons with Down syndrome as compared with a group of control subjects. We therefore compared these two populations for the prevalence and severity of three MR imaging markers of aging in the brain: atrophy, white matter lesions, and T2 hypointensity of the basal ganglia.
Sixty MR studies in 30 persons with Down syndrome and 30 age- and sex-matched control subjects were reviewed retrospectively. Indications for the examinations in the persons with Down syndrome varied from clinical need to voluntary participation in a research project unrelated to, and predating, the present study. Informed consent was obtained for all the volunteers. Clinical dementia had been diagnosed in 10 of the 30 persons with Down syndrome by an experienced neurologist at the time of the MR examination or shortly thereafter. The control group consisted of subjects whose examinations had previously been interpreted as normal and were selected from a computerized database. This database contained demographic data and results of all MR examinations conducted at our center since August 1991. For 29 of the persons with Down syndrome, the control subject was age-matched to within 1 year; in the remaining case, a 23-year-old woman with Down syndrome was matched with a 24-year-old woman from the control group. Where more than one match was possible, an attempt was made to choose the control subject whose study was closest in time to the study of the person with Down syndrome. Subjects in the study and control groups ranged in age from 23 to 60 years, with a mean age of 39 years. Each group contained 17 men and 13 women.
The MR examinations were performed on a 1.5-T superconducting magnet with a quadrature head coil. Each examination included spin-echo sagittal T1-weighted images (600-717/16-20/0.75,1 [repetition time/echo time/ excitations]) and conventional dual-echo axial proton density- weighted and T2-weighted spin-echo images (2700- 3100/30,80). The images were 5 mm thick with a 2.5-mm gap. The image matrix was either 256 3 128 or 256 3 192.
The 60 MR examinations were randomized and a retrospective, blinded review of all cases was performed in a single sitting by two independent observers (experienced radiologists who interpret most of the MR examinations at our center). Each observer was told only the age and sex of each subject. Each study was evaluated for three markers of brain aging: atrophy, white matter lesions, and T2 hypointensity of the basal ganglia. Each of the markers was scored as 0 (absent), 1 (present), or 2 (present and markedly abnormal), referenced to findings in healthy persons of that age and sex. To duplicate more closely the setting of a view box in a busy clinical practice, no set of age-adjusted external standards was provided the observers; rather, the observers were instructed to judge each case according to their own internal standard of normal for that age and sex. This was done to allow more widespread applicability to the conclusions drawn.
The data for the 30 subjects with Down syndrome are summarized in Table 1 (the 10 persons with clinical dementia are noted). Note the number of persons with abnormal (1 or 2) scores. Observer A gave 28 subjects abnormal scores on at least one marker: observer B gave 22 persons abnormal scores on at least one marker. In the control population, only four persons received an abnormal score from observer A, and each such abnormal score was a 1. Observer B considered five control subjects to have abnormal findings, and each of these abnormal scores was also a 1. Neither observer gave any control subject a grade of 2 on any marker. In the control population, there was an overlap of two patients who were thought to have a single abnormal finding by both observers. In one case it was the same abnormal finding (white matter lesions), in the other case, they disagreed on which was the solitary abnormal finding.
| Observer A | Observer B | |||||
|---|---|---|---|---|---|---|
| Age, y/Sex | Atrophy | White Matter Lesions |
T2 Hypointensity of Basal Ganglia |
Atrophy | White Matter Lesions |
T2 Hypointensity of Basal Ganglia |
| 23/F | 1 | 0 | 1 | 1 | 0 | 1 |
| 23/F | 0 | 0 | 1 | 0 | 0 | 0 |
| 23/M | 0 | 0 | 1 | 0 | 1 | 1 |
| 24/M | 1 | 0 | 1 | 0 | 0 | 0 |
| 25/M | 0 | 0 | 1 | 0 | 0 | 0 |
| 27/M | 0 | 0 | 1 | 0 | 0 | 0 |
| 28/M | 1 | 0 | 1 | 0 | 0 | 1 |
| 30/F | 0 | 0 | 1 | 0 | 0 | 1 |
| 32/M | 0 | 0 | 1 | 0 | 0 | 0 |
| 34/M | 0 | 0 | 1 | 0 | 0 | 1 |
| 36/M | 0 | 0 | 2 | 0 | 0 | 2 |
| 37/M | 0 | 0 | 2 | 0 | 0 | 0 |
| 38/F | 0 | 0 | 0 | 0 | 0 | 0 |
| 38/F | 0 | 1 | 2 | 0 | 1 | 1 |
| 39/F† | 1 | 1 | 1 | 1 | 1 | 0 |
| 39/F | 0 | 0 | 0 | 0 | 0 | 1 |
| 41/M | 0 | 0 | 1 | 0 | 0 | 0 |
| 42/M | 2 | 0 | 2 | 1 | 0 | 0 |
| 46/M† | 2 | 1 | 0 | 2 | 1 | 2 |
| 46/F† | 2 | 2 | 2 | 1 | 1 | 2 |
| 46/F | 2 | 1 | 1 | 2 | 1 | 1 |
| 47/M† | 1 | 0 | 2 | 1 | 0 | 1 |
| 47/M | 0 | 0 | 1 | 0 | 0 | 1 |
| 47/F† | 2 | 0 | 2 | 2 | 1 | 2 |
| 49/M† | 1 | 1 | 2 | 1 | 1 | 2 |
| 51/M | 0 | 0 | 1 | 0 | 0 | 1 |
| 54/M† | 2 | 2 | 1 | 2 | 2 | 2 |
| 54/F† | 0 | 1 | 1 | 1 | 1 | 2 |
| 55/F† | 2 | 1 | 2 | 2 | 1 | 1 |
| 60/F† | 1 | 2 | 0 | 2 | 2 | 0 |
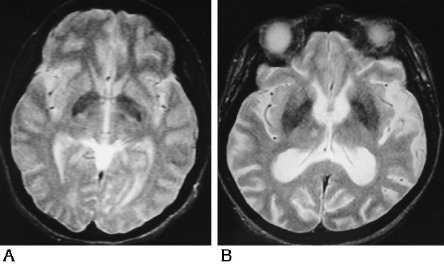
Each of the three markers of aging (atrophy, white matter lesions, and T2 hypointensity of the basal ganglia) was then evaluated independently using Wilcoxon's signed rank test to determine whether the persons with Down syndrome differed significantly from the control subjects. These findings are summarized in Table 2. The results given are corrected for ties. Evaluating the two populations for atrophy, observer A diagnosed atrophy in 14 of the persons with Down syndrome but in none of the control subjects (Ρ <.0007), whereas observer B diagnosed atrophy in 13 of the persons with Down syndrome and in two of the control subjects (Ρ <.002). Figure 1 represents the grading system for atrophy. The entire set of images for each subject was analyzed for signs of atrophy; two examples are shown. Figure 1A shows dilatation of the temporal horns of the lateral ventricles, more marked on the right than on the left on this selected image. Given the clinical information that this was a 23-year-old woman, both observers gave this finding a grade of 1. Figure 1B shows temporal horn dilatation and widened cortical sulci in a 46-year-old woman; both observers gave these findings a grade of 2. The prevalence of white matter lesions also differed between the two populations. Observer A identified white matter lesions in 10 of the persons with Down syndrome and in three of the control subjects (Ρ <.026); observer B identified white matter lesions in 12 of the persons with Down syndrome and in two of the control subjects (Ρ <.007).
| Fig 1. Representative spin-echo MR images (3000/80) from persons with Down syndrome illustrate the scores of 1 and 2 for atrophy. A, This 23-year-old woman with dilatation of the temporal horns received an atrophy score of 1. B, This 46-year-old woman with dilatation of the temporal horns and widened cortical sulci received an atrophy score of 2. |
 |
| Fig 2. Representative spin-echo MR
images (3000/80) from persons with Down syndrome illustrate the scores of 1
and 2 for white matter lesions. A, This 38-year-old woman with abnormal T2 hyperintensity of the white matter on the left received a white matter score of 1. B, Multifocal confluent white matter lesions throughout the corona radiata resulted in a white matter score of 2 for this 54-year-old man. |
 |
Abnormal T2 hypointensity of the basal ganglia was by far the most common abnormality detected in the persons with Down syndrome. Observer A detected abnormal T2 hypointensity of the basal ganglia in 26 of the persons with Down syndrome but in only one of the control subjects (Ρ < .0001); observer B noted this in 19 of the persons with Down syndrome but in only one control subject (Ρ < .0001). Figure 3 represents the grading system for abnormal T2 hypointensity of the basal ganglia. Figure 3A shows T2 hypointensity in the basal ganglia graded as excessive for this 30-year-old woman, resulting in a score of 1 from both observers. More striking is the extent of abnormal T2 hypointensity of the basal ganglia in Figure 3B, which both observers rated as a 2. This 47-year-old woman had abnormal T2 hypointensity of the basal ganglia extending into the putamen. In their study of healthy volunteers, Milton and coworkers (4) noted putamenal iron only in subjects over the age of 65 years. To determine the variation between the two observers, Spearman's rank correlation was performed, and determined a ρ of .89 (Ρ < .0001) for atrophy and a ρ of .91 (Ρ < .0001) for white matter lesions. The observers were somewhat discordant in determining the presence of abnormal T2 hypointensity of the basal ganglia, with a ρ of .38 (Ρ = .039).
| Fig 3. Representative spin-echo MR images (3000/80) from persons with Down syndrome illustrate the scores of 1 and 2 for abnormal T2 hypointensity of the
basal ganglia. A, This 30-year-old woman received a basal ganglia T2 hypointensity score of 1. B, This 47-year-old woman with extension of the iron deposition into the putamen received a basal ganglia T2 hypointensity score of 2. |
 |
Using Wilcoxon's rank sum test, we also determined that the prevalence of both atrophy and white matter lesions increased with age in the persons with Down syndrome. For atrophy, the Ρ values were .034 for observer A and .0007 for observer B. The Ρ values for white matter lesions were .0009 for observer A and .0023 for observer B. The Wilcoxon's rank sum test did not, however, show a statistically significant age-dependent clustering of persons with abnormal T2 hypointensity of the basal ganglia. Abnormal T2 hypointensity of the basal ganglia was seen in many of the younger patients and was often the earliest detectable marker of premature aging. This can be seen by scanning the data in Table 1.
The data also demonstrated differences in the multiplicity and the severity of the markers between the two populations. Specifically, multiple markers were present in the persons with Down syndrome but not in the control subjects. Of the 28 persons with Down syndrome given an abnormal grade by observer A, 16 (57%) had multiple abnormalities. For observer B, multiple abnormalities were seen in 14 (64%) of the 22 persons with Down syndrome who received an abnormal grade. Every abnormality diagnosed in a control group member, however, was a solitary abnormality. As for marker severity, inspection of Table 1 shows that many of the persons with Down syndrome had markers scored as 1 or 2, and that the severity of the markers increased with age. In contrast, every abnormality in the control group members was scored as a 1.
With the exception of one person with Down syndrome who had a porencephalic cyst (which was noted by both observers), the other imaging studies showed only the three markers of aging just discussed.
Down syndrome is a leading cause of mental retardation, occurring with a frequency of one in 1000 newborns in the United States (10). It results from an excess of genetic material from chromosome 21, caused by trisomy of chromosome 21 in more than 90% of cases, by translocation involving this chromosome in 4% of cases, or by chromosomal mosaicism in 2% to 3% of cases (10). In addition to mental retardation, persons with Down syndrome are seen to have abnormal central nervous system morphology at autopsy, including brachycephaly, reduced brain weight, an abnormal rounded contour to the brain, a narrow superior temporal gyrus, and hypoplasia of the inferior frontal gyrus leading to exposure of the insula (10). During their shortened life span, persons with Down syndrome show somatic degenerative changes, as in skin and hair, earlier than do mentally retarded persons without Down syndrome (7, 9). As for the central nervous system, histologic changes identical to those seen in Alzheimer disease also appear prematurely in persons with Down syndrome. Specifically, histologic examination reveals senile plaques, neurofibrillary tangles, and granulovacuolar degeneration of nerve cells in almost all persons over age 45 years (8). The current study demonstrates that anatomic changes in the brain, previously identified as consistent with normal aging, occur prematurely in the brains of persons with Down syndrome. These anatomic changes can be appreciated in vivo by means of CT and MR imaging.
Previous investigators have shown that CT can often show one such marker of aging, atrophy, that differs in age of onset and extent when the brains of persons with Down syndrome are compared with those of control subjects. Wisniewski et al (11) identified atrophy in 27 of 30 persons with Down syndrome, a finding initially disputed by Schapiro et al (12). In a follow- up study 2 years later, however, Schapiro et al (13) reported that cerebral atrophy and ventricular dilatation did occur, but only in older persons with Down syndrome who were demented. LeMay and Alvarez (7) detected significant widening of the temporal horns in persons with Down syndrome over the age of 50 years and noted a correlation between the CT findings and the presence and severity of dementia. Pearlson et al (14) identified changes consistent with brain atrophy or hypoplasia occurring in community-dwelling persons with Down syndrome, becoming particularly prominent after the age of 40 years. Seven of their 18 patients satisfied clinical criteria for dementia. In our study, 10 persons satisfied clinical criteria for dementia. As can be seen from Table 1, in which the persons with dementia are noted, these persons were predominantly the older patients studied. They were included in our data because to eliminate them would have biased the study toward those aged persons who do not become demented. Our data, therefore, are more representative of an unselected group of persons with Down syndrome at various ages.
MR imaging has been used previously to study persons with Down syndrome. Pelz et al (15) found mild generalized atrophy in two of seven persons with Down syndrome and marked left temporal lobe atrophy in one patient. No abnormal white matter lesions were seen. Tamraz et al (16) identified atrophy in four of seven persons with Down syndrome. The presence or absence of white matter lesions was not addressed. In addition, neither study commented on the signal intensity of the basal ganglia. Both studies were performed at low field strength (0.15 T), however, which would make detection of any such abnormality more difficult. More-precise determinations of the structural differences between persons with Down syndrome and control subjects have been obtained with the use of quantitative methods. Weis et al (17, 18) combined MR imaging with stereologic methods to determine that smaller volumes of whole brain, cerebral cortex, white matter, and cerebellum are seen in persons with Down syndrome than in control subjects. This discrepancy persists after normalizing for the volume of the cranial cavity, unlike in the CT studies by Schapiro et al (12, 13). Using coronal inversion recovery MR imaging coupled with quantitative analysis, Kesslak et al (19) showed that persons with Down syndrome have a larger parahippocampal gyrus but a smaller hippocampus and neocortex than do age-matched control subjects. They also noted a significant increase in ventricular area with age in the persons with Down syndrome but not in the control group. The current study builds on this previous work by showing that additional age-related differences between the brains of persons with Down syndrome and those of age- and sexmatched control subjects can be identified on routine spin-echo MR imaging sequences. Specifically, the brains of persons with Down syndrome show increased prevalence of white matter lesions and premature development of T2 hypointensity in the basal ganglia as compared with those of control subjects. Although Pelz et al (15) looked for white matter lesions in their seven subjects with Down syndrome, none had this finding. This may be related to the difference in the number of subjects studied, seven versus the 30 in our study, or to the differing field strengths of the units, 0.15 T versus the present 1.5 T. As for the finding of premature development of T2 hypointensity in the basal ganglia of persons with Down syndrome as compared with control subjects, we believe that this is most likely due to premature iron deposition. While noting that persons with Down syndrome have an increased prevalence of calcification of the basal ganglia compared with that in healthy persons, in the majority of these cases the calcification was localized to the globus pallidus (11, 20-22). In our most severe cases, abnormal T2 hypointensity was seen in the putamen as well. In addition, abnormal T2 hypointensity of the basal ganglia is seen in conjunction with several other diseases, presumably also due to abnormal iron deposition. These include the Parkinson plus syndromes (multisystem atrophy and progressive supranuclear palsy) (23) and multiple sclerosis (24). Abnormal iron deposition in the basal ganglia can also be seen in children after cerebral infarction (25) or an ischemic-anoxic episode (26).
Our results also show that the brains of persons with Down syndrome display atrophic changes earlier and to a greater extent than those seen in age- and sex-matched control subjects, which is in keeping with the work of many other researchers (7, 11, 13-19). In addition, we have shown that experienced radiologists can identify the atrophic changes by simple inspection, contrary to previous assertion (17). Use of a grading system in which the observer knows the age of the patient made this possible. Although an argument can be raised that such a grading system is arbitrarily subjective, we note that the grading of brain atrophy on CT and MR studies is well established and also depends on the observer's knowing the age of the patient. Specifically, the same imaging findings can be graded as normal or highly abnormal depending on whether the age of the subject given to the grader is 40 or 80. We have applied the same reasoning to the evaluation of the white matter and the basal ganglia. Crucial to the study design was the randomization of the 30 subjects with Down syndrome with the 30 control subjects. The fact that the observers graded these two populations as significantly different, as can be seen from the Ρ values in Table 2, argues that there is a true difference between these populations on the characteristics studied, even if the assessment of these characteristics is somewhat subjective.
| Observer A | Observer B | |
|---|---|---|
| Atrophy | .0007 | .002 |
| White matter lesions | .026 | .007 |
| T2 hypointensity of basal ganglia | <.0001 | <.0001 |
In summary, we have shown that persons with Down syndrome have features of premature aging that can be appreciated on simple inspection of routine spin-echo MR imaging sequences. Atrophic changes and white matter lesions are more prevalent and more severe in persons with Down syndrome as compared with age- and sex-matched control subjects. T2 hypointensity of the basal ganglia is also identified more frequently and at a younger age in persons with Down syndrome than in control subjects. This abnormal T2 hypointensity of the basal ganglia is often the earliest detectable marker of premature aging.
We thank Howard Tucker and Ashod Minasian of the Department of Mathematics for their help in deciding on and performing some of the statistical analyses in this paper.